


Bitcoin investors are now growing increasingly concerned that the top of this cycle may already be in place, with many fearing that a substantial price crash could soon follow.
Despite these concerns, there are still several critical areas and key elements in the market structure that could provide support and potentially drive the asset higher, paving the way for another phase of bullish continuation.
By Shayan
The Daily Chart
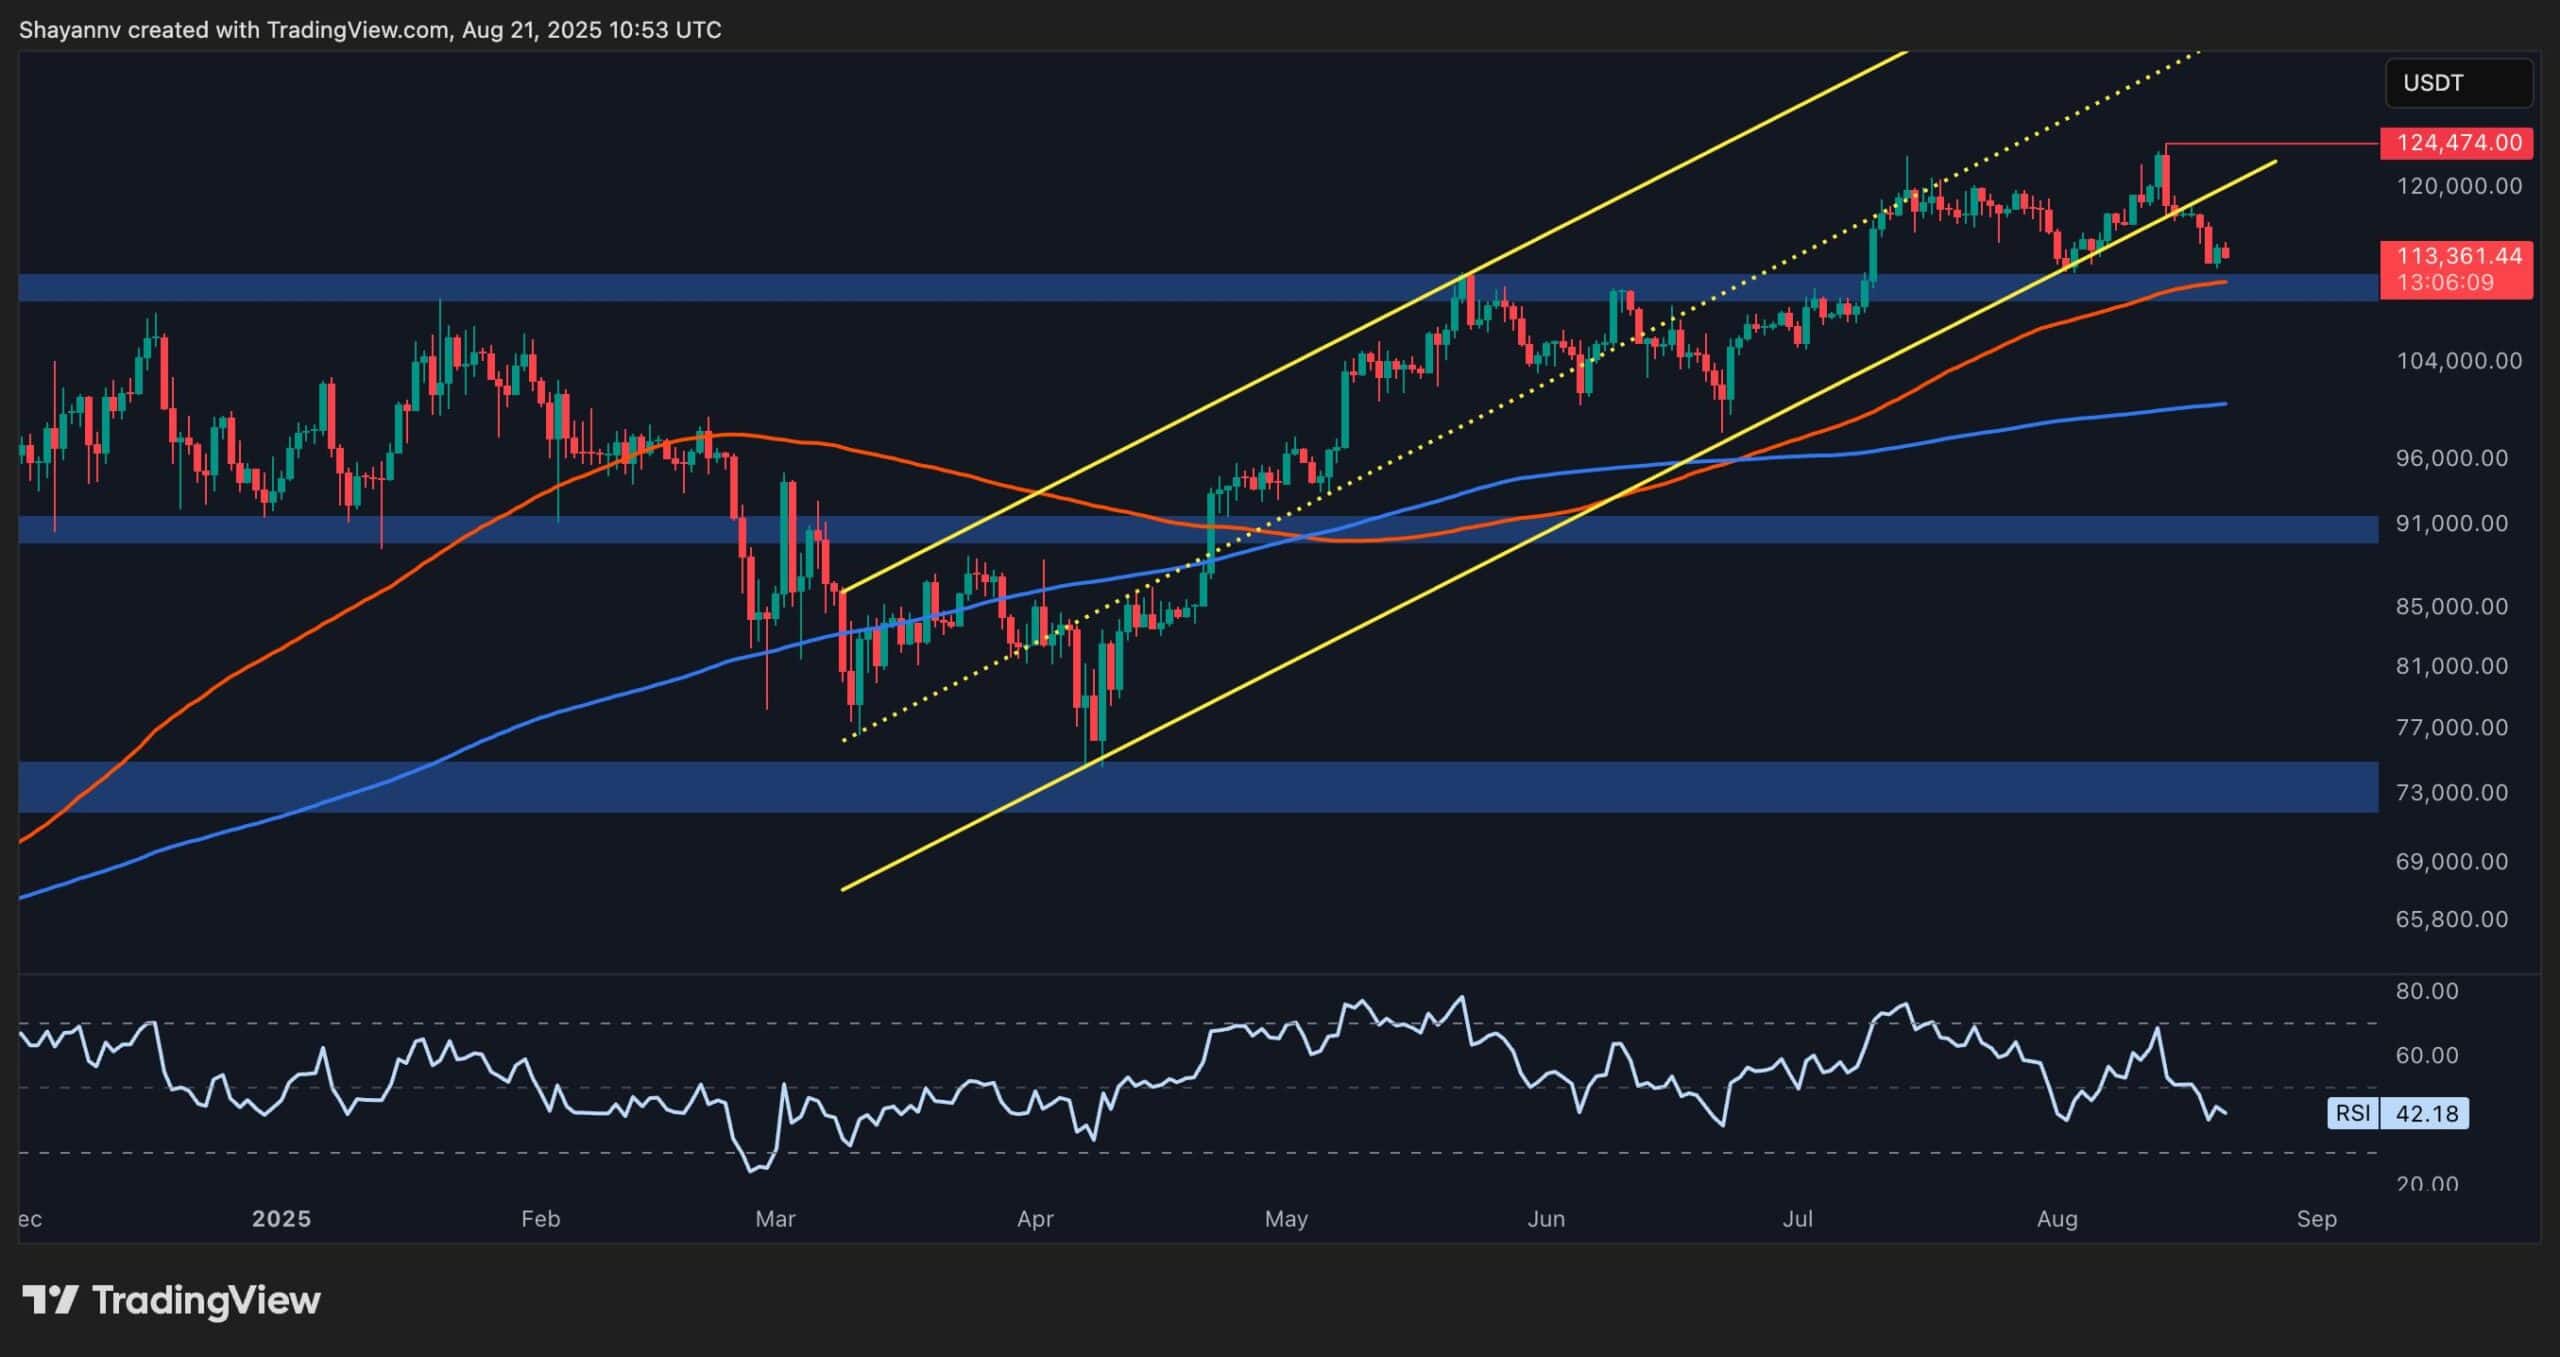
On the daily chart, Bitcoin has been climbing within a long-term ascending channel for the past few months, breaking through multiple resistance levels and ultimately setting a new all-time high above $124K.
However, the price has recently broken down from this channel with strong momentum and is now moving toward the critical $110K-$112K support zone, which also aligns with the 100-day moving average.
The market’s reaction to this level will likely define the broader trend for the weeks and months ahead, as it stands as a decisive make-or-break area that could either trigger a deeper correction or fuel another bullish rebound. For now, the key question is whether buyers can defend this support or if sellers will maintain control and drive prices lower.
The 4-Hour Chart
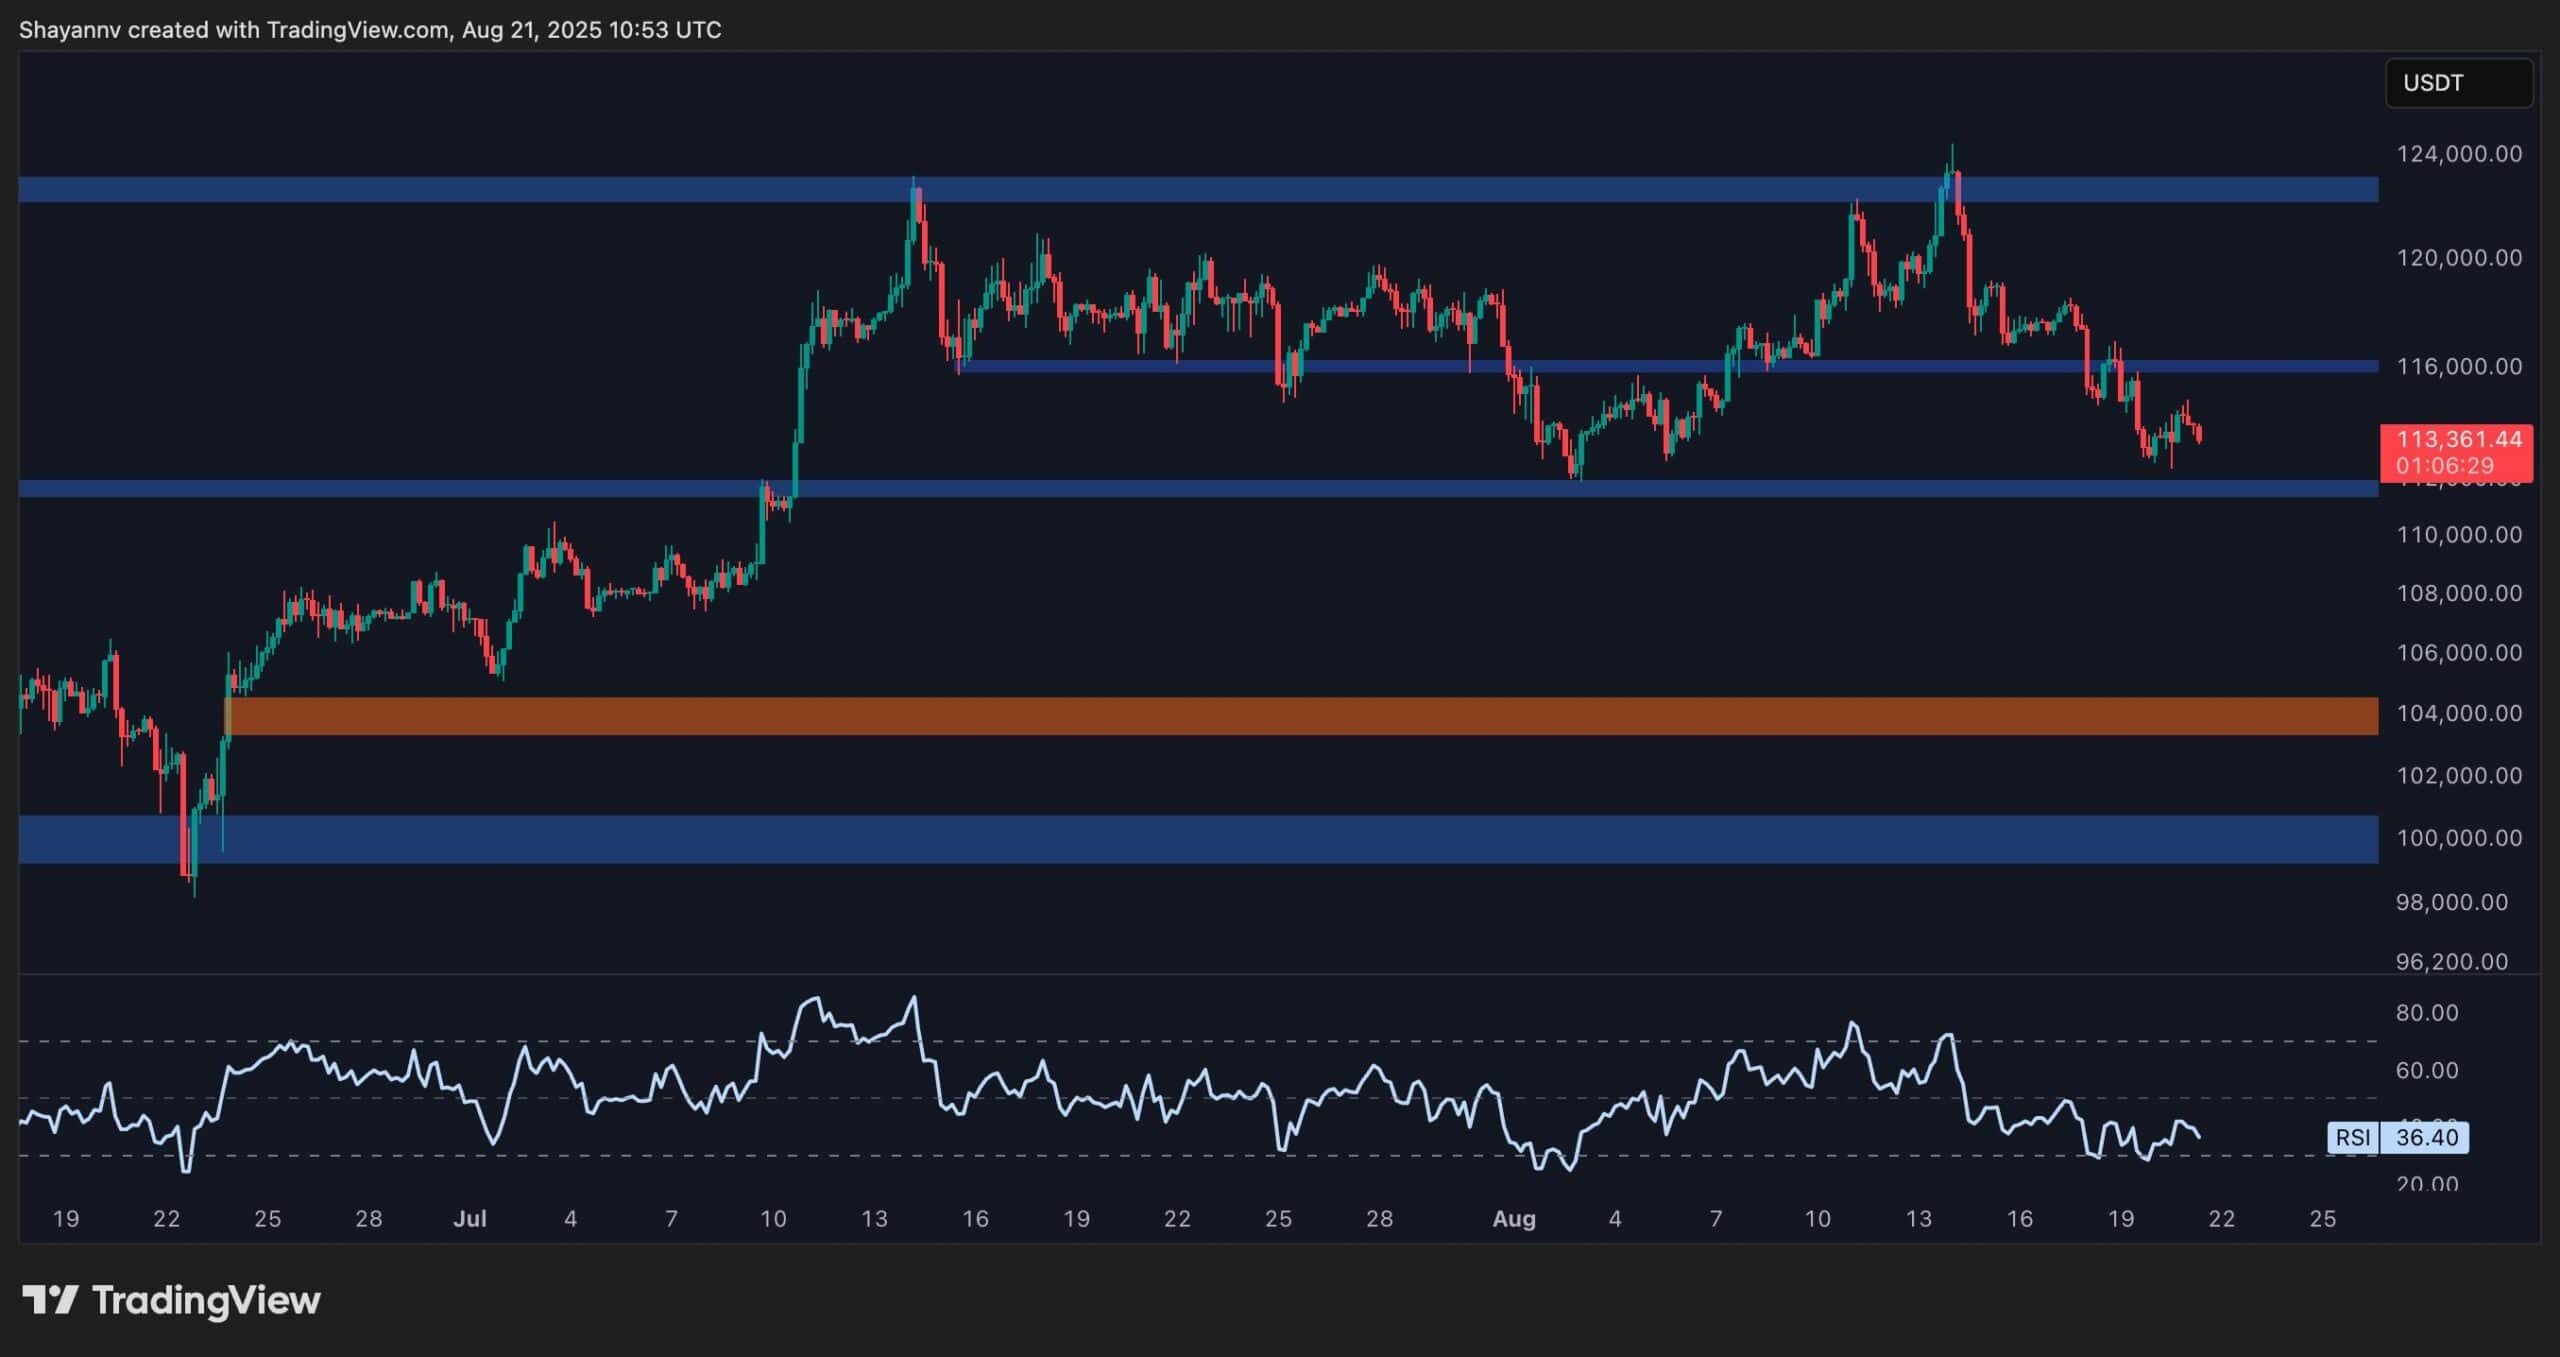
Shifting to the 4-hour chart, the significance of the $112K support level becomes evident, as it represents the previous swing low. A decisive breakdown below this area would shift the market structure into bearish territory for the weeks ahead based on price action principles.
At the same time, the RSI remains under the 50 mark, signalling clear bearish momentum, and is now approaching oversold conditions, which could materialize if the $112K zone fails to hold.
As a result, investors are closely watching this level, as a breakdown could open the door for a continuation lower toward the critical $104K bullish fair value gap. This zone sits beneath multiple early July lows, making it a high-probability target and a potential area for a bullish reversal if tested.
Onchain Analysis
Active Addresses
The chart above shows the 100-day moving average of Bitcoin’s active addresses. While BTC’s price has managed to reach new all-time highs above $113K, the number of active addresses has not followed the same path.
This clear divergence between price and network activity suggests that while capital inflows and speculative demand are driving prices higher, the actual on-chain usage and participation are not expanding at the same pace. Historically, strong bull markets are often supported by growth in active addresses, as it reflects rising adoption and broader user engagement with the network.
At the moment, active addresses are not only well below their peak but also continue to decline, even as Bitcoin trades near record levels. This lack of confirmation from on-chain activity raises concerns about the sustainability of the rally, as it implies that fewer unique participants are driving the price action.
If the downward trend in active addresses persists, it could signal weakening fundamentals behind the price surge, making the market more vulnerable to corrections.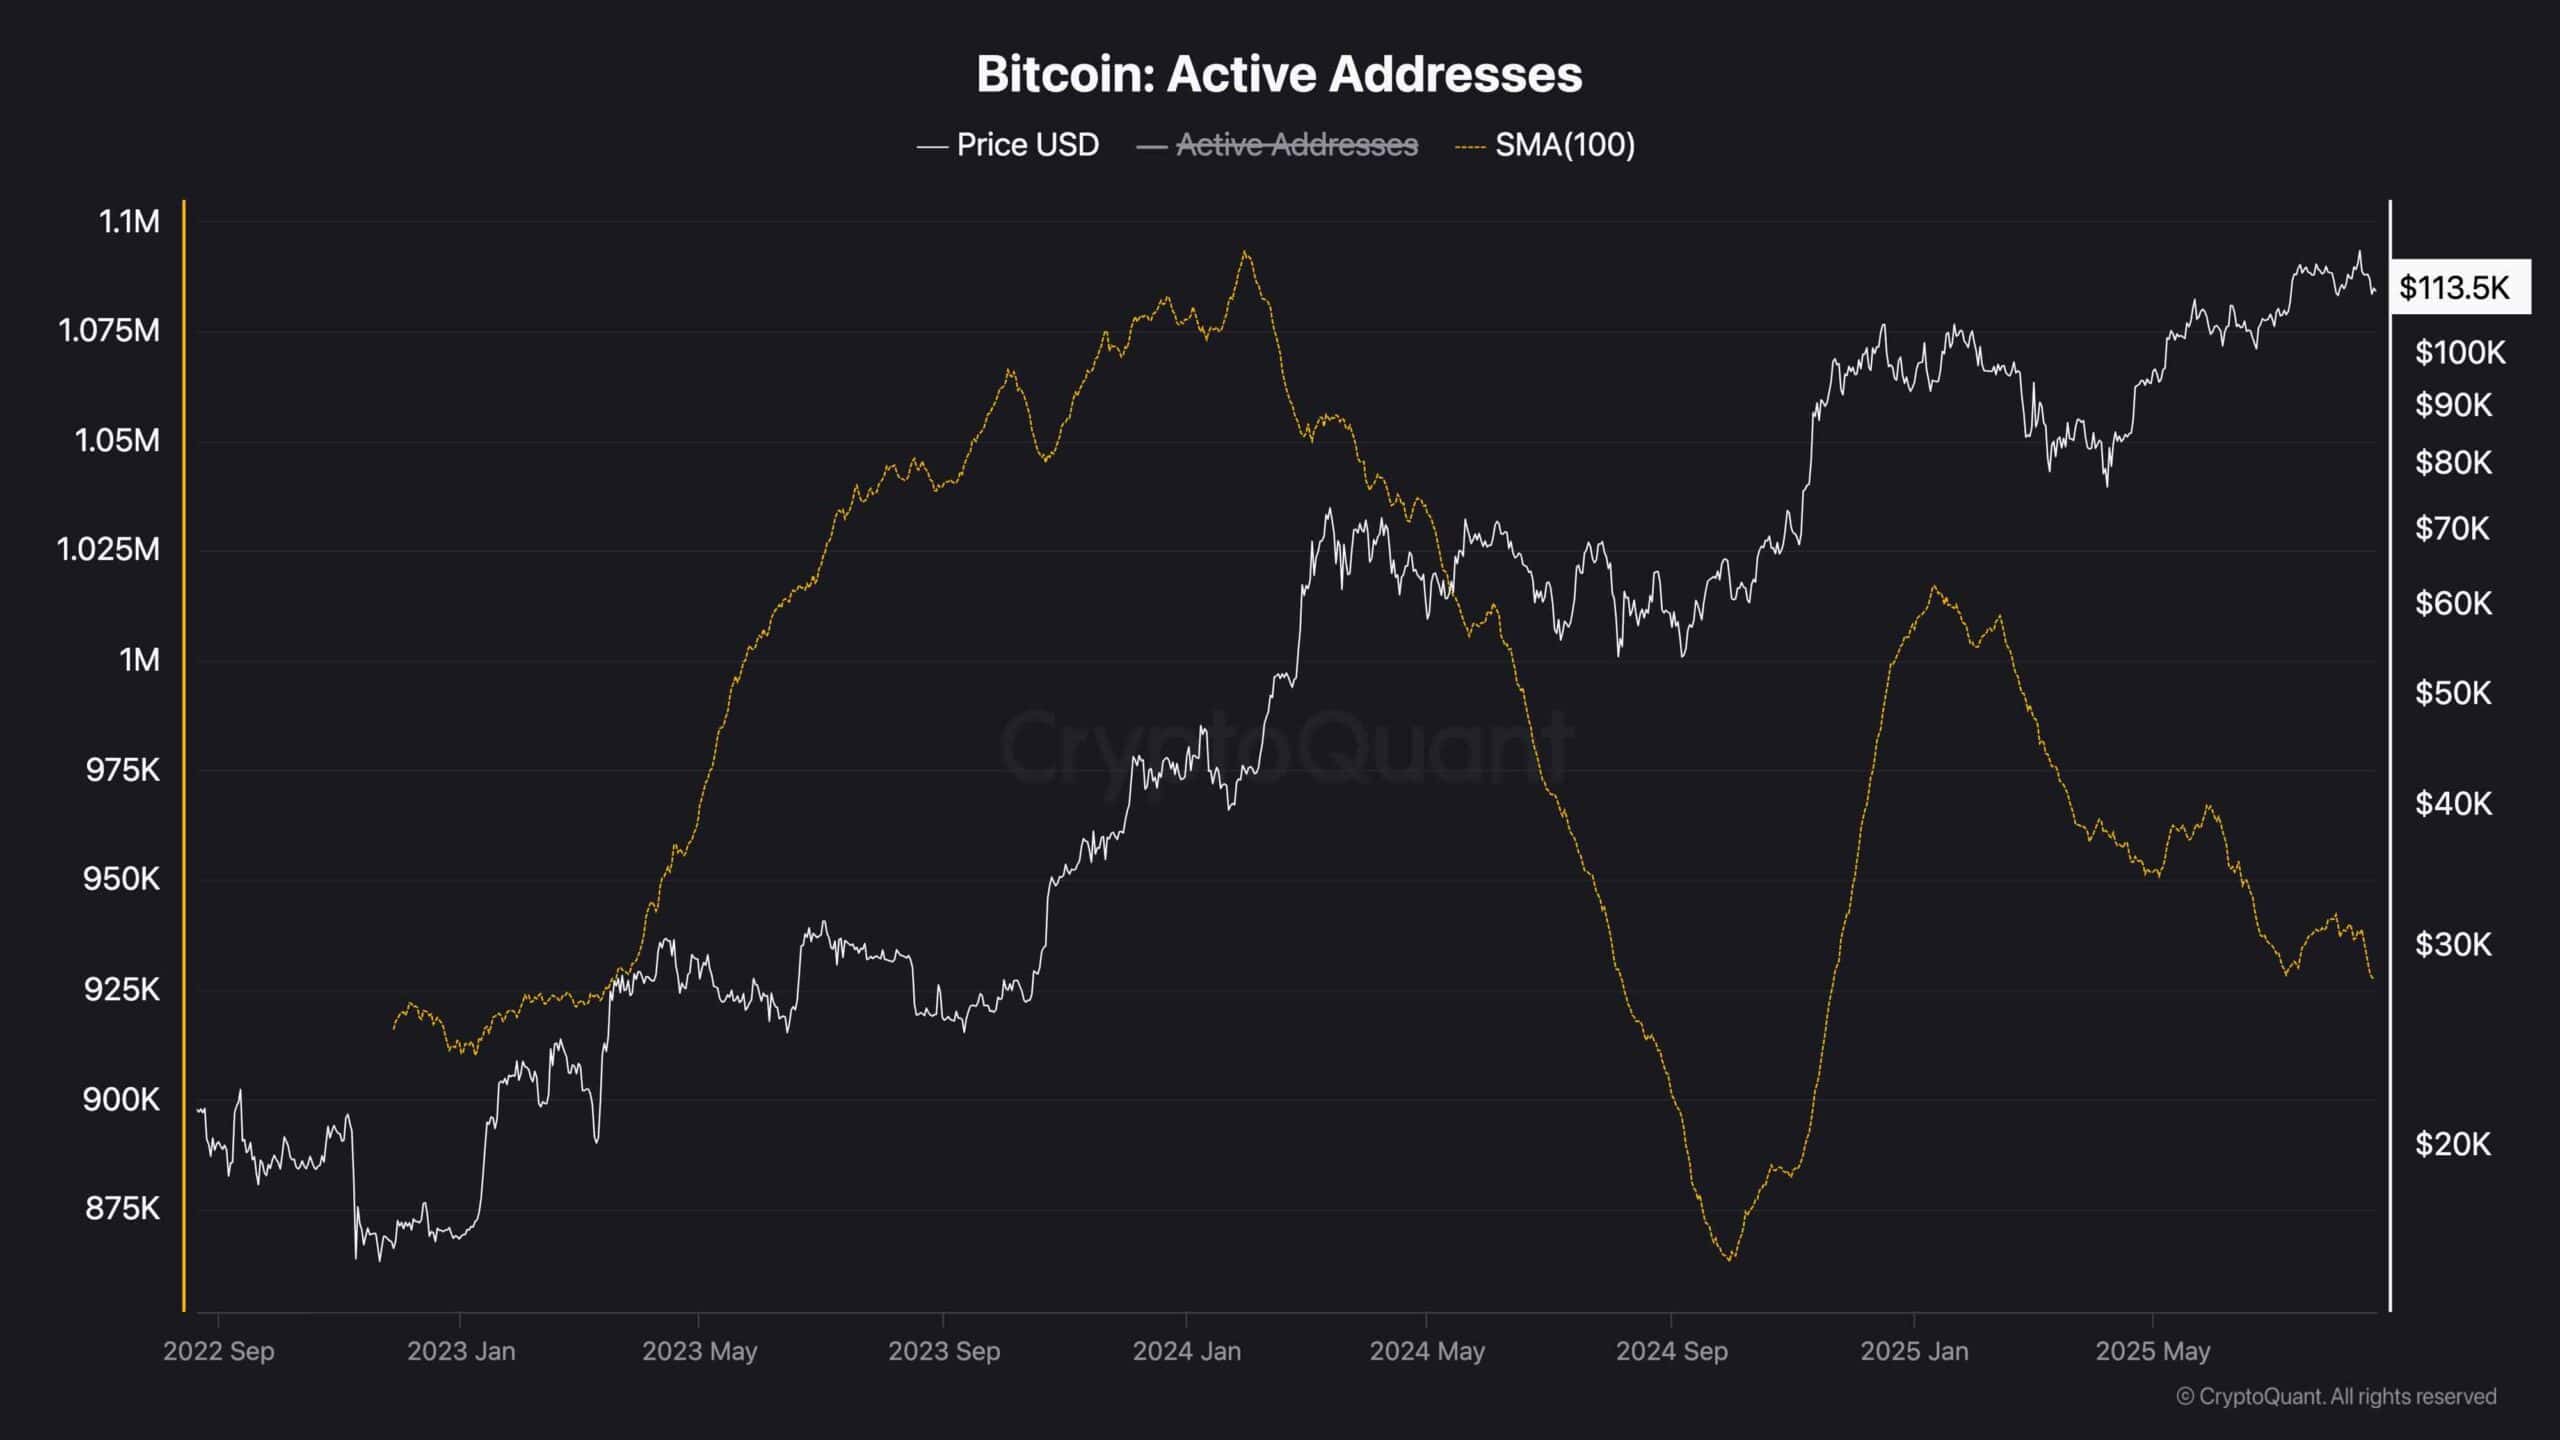
Binance Free $600 (CryptoPotato Exclusive): Use this link to register a new account and receive $600 exclusive welcome offer on Binance (full details).
LIMITED OFFER for CryptoPotato readers at Bybit: Use this link to register and open a $500 FREE position on any coin!
Disclaimer: Information found on CryptoPotato is those of writers quoted. It does not represent the opinions of CryptoPotato on whether to buy, sell, or hold any investments. You are advised to conduct your own research before making any investment decisions. Use provided information at your own risk. See Disclaimer for more information.
Cryptocurrency charts by TradingView.
