


TL;DR
- MNT breaks past $1.65 ATH after strong breakout from long-term trendline and double bottom.
- The weekly chart shows a bullish structure with rising support and strong price continuation above $1.44.
- Momentum indicators confirm strength as MNT trades above Bollinger Bands with a MACD bullish crossover.
Monthly Chart Breaks Long-Term Resistance
Mantle’s token MNT reached a new all-time high of $1.65 today, after closing a monthly candle above a long-standing descending trendline. This trendline connected previous highs from April 2024 and January 2025.
Notably, the monthly chart also shows a double bottom formation, with lows developing around mid-2024 and mid-2025. The price has now closed above the neckline of that pattern. According to Trader Tardigrade, “the current candle’s body is entirely above the resistance trendline.” This development could mark the beginning of a change in structure.
$MNT‘s monthly chart looks promising
The current candle’s body is entirely above the resistance trendline formed by the peaks in April 2024 and January 2025.
The chart clearly shows strong momentum after a double bottom pattern.
I believe this new candle has turned a new page… pic.twitter.com/qaKVJfOP53— Trader Tardigrade (@TATrader_Alan) September 10, 2025
Trading Volume and Exchange Updates
MNT’s current 24-hour trading volume is $662 million, with a 24-hour price range between $1.34 and $1.65. The asset is up 18% in the past 24 hours and 47% over the last 7 days. Market cap is now at $4.02 billion, up 15% week-over-week.
Crypto analyst Finish noted that MNT serves as Bybit’s core utility token and mentioned the possibility of future supply reductions through buyback and burn programs. “Many great things are loading,” they said, though the results remain uncertain.
Bybit recently added 21 new spot trading pairs for MNT. This could expand trading activity as more pairs offer access to different markets.
Meanwhile, the weekly chart shows the price moving above the previous peak of $1.44, which was set earlier in 2025. After a clean breakout, MNT briefly pulled back to the $1.13 area, which lines up with earlier resistance and may now act as support.
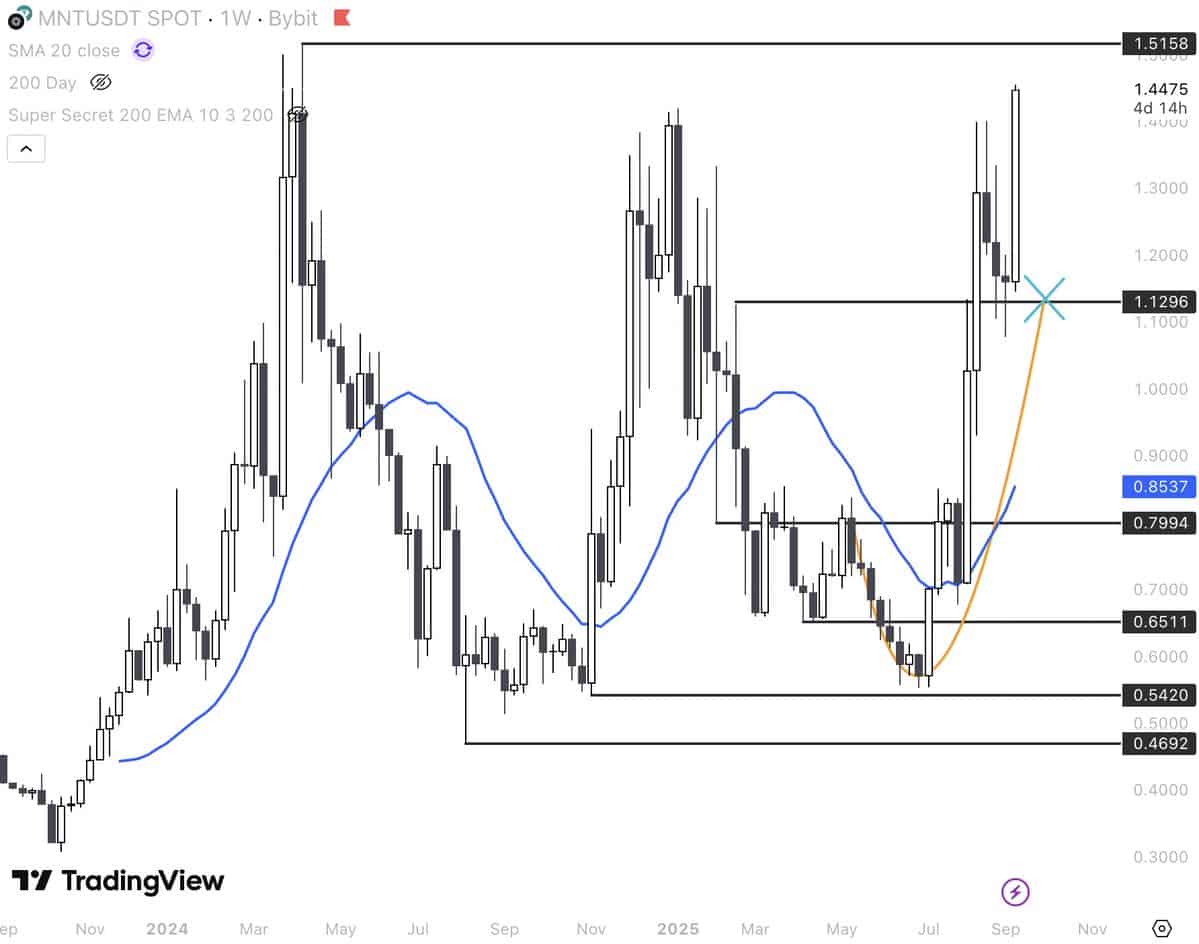
The 20-week moving average has turned upward, and the price remains above it. Before this move, MNT had spent several weeks consolidating between $0.60 and $0.70, forming a rounded bottom. That zone acted as a base before the current breakout began.
Momentum Signals Remain Active on Daily Chart
On the daily chart, MNT is trading above the upper Bollinger Band, which currently sits at $1.48. It is now at $1.66, suggesting strong momentum. Moves outside the upper band are often seen during rapid price expansions.
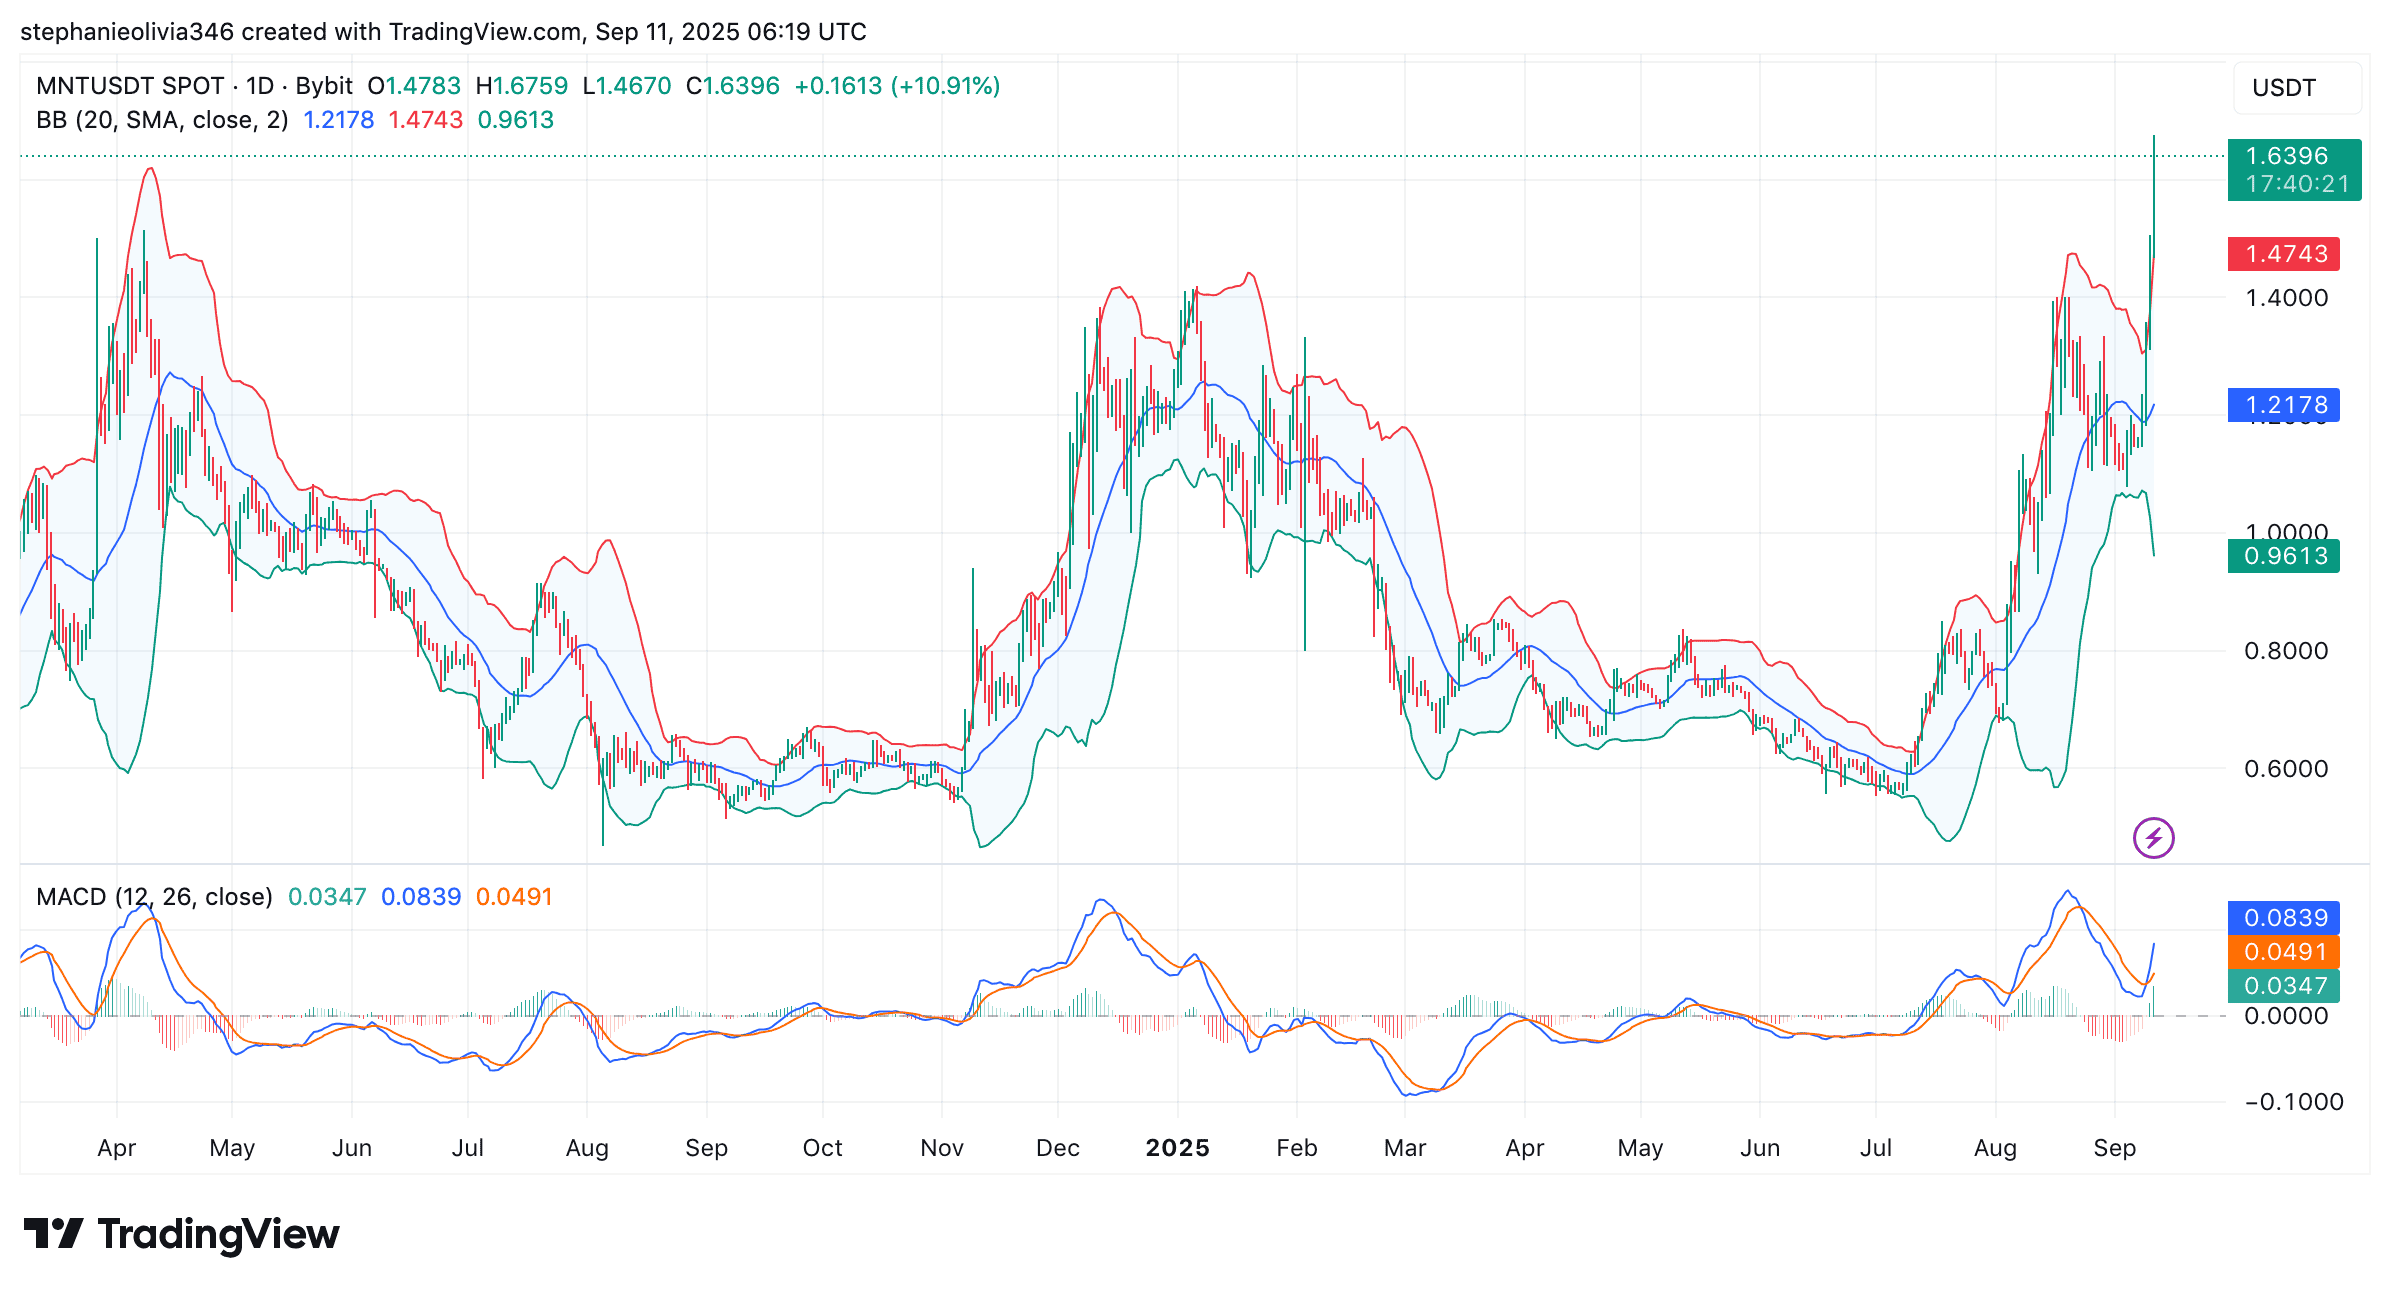
Another observation is a recent bullish crossover in the MACD indicator. The MACD line has risen above the signal line, with the histogram extending farther above the zero line. Such readings continue to dictate that upward momentum remains alive without any immediate signs of reversal.
Binance Free $600 (CryptoPotato Exclusive): Use this link to register a new account and receive $600 exclusive welcome offer on Binance (full details).
LIMITED OFFER for CryptoPotato readers at Bybit: Use this link to register and open a $500 FREE position on any coin!
